


Net Sales
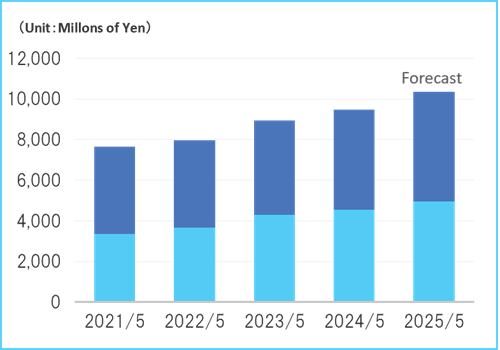
| 2022/5 | 2023/5 | 2024/5 | 2025/5 | 2026/5 | |
|---|---|---|---|---|---|
| Year | 7,947 | 8,923 | 9,468 | 10,473 | 12,119 |
| Half Year | 3,675 | 4,302 | 4,541 | 4,962 | 5,835 |
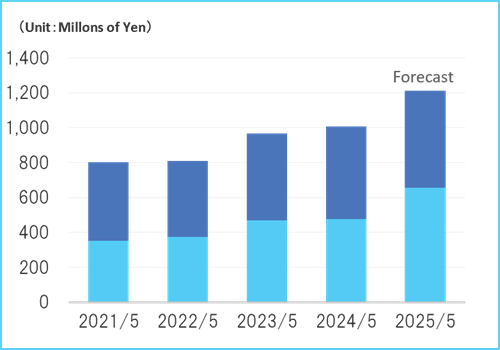
Operating Income
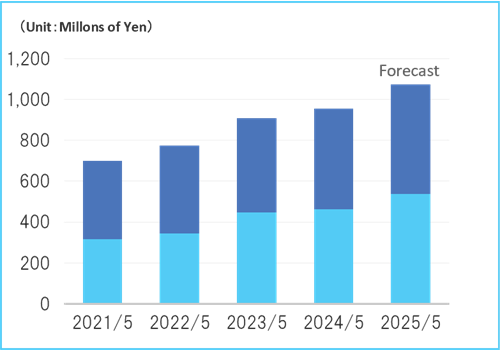
| 2022/5 | 2023/5 | 2024/5 | 2025/5 | 2026/5 | |
|---|---|---|---|---|---|
| Year | 775 | 908 | 956 | 1,144 | 1,509 |
| Half Year | 344 | 447 | 462 | 538 | 739 |
| Profit Ratio | 9.8 | 10.2 | 10.1 | 10.9 | 12.5 |
Ordinary Income
| 2022/5 | 2023/5 | 2024/5 | 2025/5 | 2026/5 | |
|---|---|---|---|---|---|
| Year | 808 | 967 | 1,008 | 1,281 | 1,525 |
| Half Year | 373 | 467 | 476 | 654 | 753 |
| Profit Ratio | 10.2 | 10.8 | 10.6 | 12.2 | 12.6 |
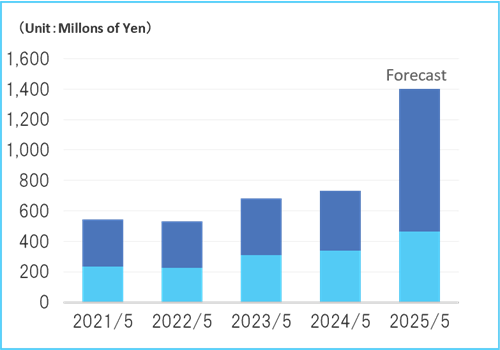
Profit Attributable to Owners of Parent
| 2022/5 | 2023/5 | 2024/5 | 2025/5 | 2026/5 | |
|---|---|---|---|---|---|
| Year | 532 | 682 | 730 | 1,478 | 1,138 |
| Half Year | 225 | 308 | 340 | 464 | 558 |
| Profit Ratio | 6.7 | 7.6 | 7.7 | 14.1 | 9.4 |
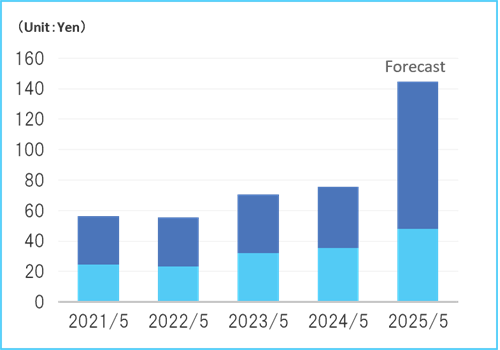
Earnings per Share
| 2022/5 | 2023/5 | 2024/5 | 2025/5 | 2026/5 | |
|---|---|---|---|---|---|
| Year | 55.63 | 70.70 | 75.56 | 152.76 | 117.51 |
| Half Year | 23.42 | 32.02 | 35.25 | 48.06 | 57.64 |
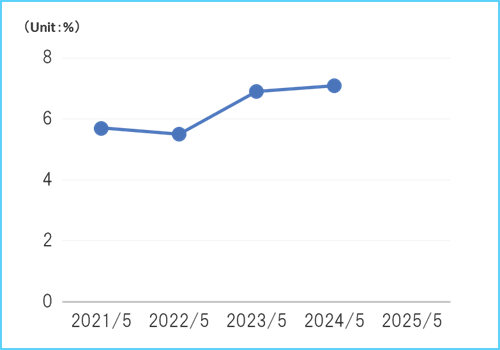
Return on Equity
| 2022/5 | 2023/5 | 2024/5 | 2025/5 | 2026/5 | |
|---|---|---|---|---|---|
| Year | 5.5 | 6.9 | 7.1 | 13.7 | 10.0 |
Total Assets
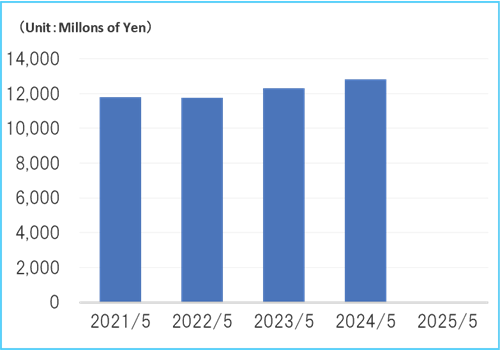
| 2022/5 | 2023/5 | 2024/5 | 2025/5 | 2026/5 | |
|---|---|---|---|---|---|
| Year | 11,735 | 12,311 | 12,803 | 14,473 | 14,594 |
Net Assets
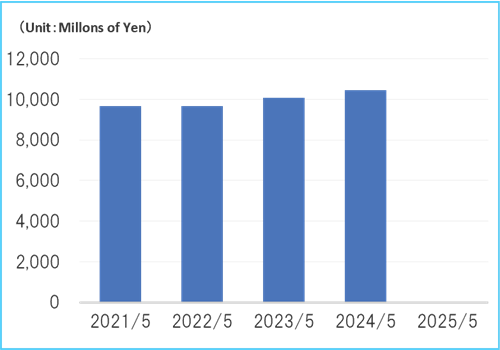
| 2022/5 | 2023/5 | 2024/5 | 2025/5 | 2026/5 | |
|---|---|---|---|---|---|
| Year | 9,671 | 10,077 | 10,456 | 11,088 | 11,626 |
Annual Dividend per Share
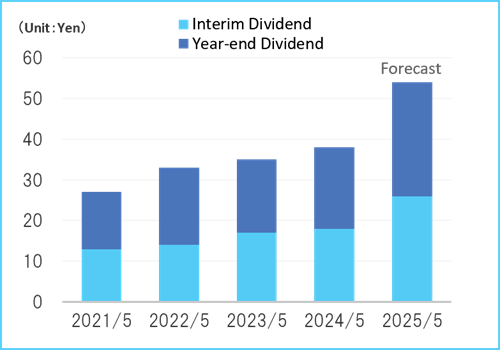
| 2022/5 | 2023/5 | 2024/5 | 2025/5 | 2026/5 | |
|---|---|---|---|---|---|
| Annual Dividend | 33.0 | 35.0 | 38.0 | 62.0 | 76.0 |
| Year-end Dividend | 19.0 | 18.0 | 20.0 | 36.0 | 43.0 |
| Interim Dividend | 14.0 | 17.0 | 18.0 | 26.0 | 33.0 |
Financial Position
(Unit: Millions of Yen)
| Item | 2025/5 | 2026/5 |
|---|---|---|
| Total assets | 14,473 | 14,594 |
| Current assets | 11,909 | 12,937 |
| Fixed assets | 2,564 | 1,656 |
| Total liabilities | 3,384 | 2,967 |
| Current liabilities | 3,351 | 2,934 |
| Fixed liabilities | 33 | 33 |
| Total net assets | 11,088 | 11,626 |
| Shareholder's equity | 11,001 | 11,496 |
| Capital stock | 1,487 | 1,487 |
| Capital surplus | 2,281 | 2,295 |
| Earned surplus | 7,836 | 8,306 |
| Treasury stock | -603 | -592 |
| Accumulated other comprehensive income | 87 | 129 |
Cash Flow
(Unit: Millions of Yen)
| Item | 2025/5 | 2026/5 |
|---|---|---|
| Cash flows from operating activities | 498 | 191 |
| Cash flows from investing activities | 1,030 | 425 |
| Cash flows from financing activities | -444 | -665 |
| Cash and cash equivalents at end of year | 5,664 | 5,642 |
Segment Information
(Unit: Millions of Yen)
| Business Segment | Sales | Income | |||
|---|---|---|---|---|---|
| 2025/5 | 2026/5 | 2025/5 | 2026/5 | ||
| Control Systems | Year | 1,705 | 1,945 | 403 | 487 |
| Half Year | 766 | 901 | 190 | 214 | |
| Automotive Systems | Year | 2,407 | 2,632 | 602 | 649 |
| Half Year | 1,193 | 1,340 | 295 | 355 | |
| Particular Information Systems |
Year | 1,793 | 2,013 | 495 | 523 |
| Half Year | 858 | 947 | 203 | 237 | |
| Embedded Systems | Year | 1,476 | 1,838 | 267 | 371 |
| Half Year | 671 | 880 | 107 | 169 | |
| Industry & ICT Solutions |
Year | 3,089 | 3,689 | 596 | 764 |
| Half Year | 1,473 | 1,766 | 265 | 336 | |
Note: The segment income does not include company-wide expenses not allocated to each segment.